SECTION 51
 HOW DYNAMIC ARE THE EME CONDITIONS YEAR-OVER-YEAR? WHAT TO EXPECT IN 2016-2017 and beyond...
(July 17th, 2016)
Have you ever wondered why sometimes the EME conditions appear to be "extremely good" while at some other periods in the month they seem to be "extremely poor"? Is going from "extremely good" to "extremely poor" a consistent pattern in the world of EME, or these swings in the conditions may become much "less extremes" at some point in time and we could see conditions that are let's say "consistently fair" throughout the entire the month but never "extremely good"? How dynamic is this whole thing?
Just like it is the case for most phenonena in astronomy, the key factors affecting the quality of the EME conditions follow complex cycles and one may not fully appreciate the implications of these unless one takes a closer look at the situation.
It is important to emphasize that each QTH is unique, hence, the analysis described in this page cannot be generalized to all locations. However, the key concepts can be utilized so an EME practitioner can perform the same type of analysis for its own situation.
Below three very known key factors which affects the quality of the EME conditions are:
1) Moon Distance: up to ~2.2 dB penalty during apogee compared to perigee.
2) Sky Noise: up to many dB penalty due to additional noise. The Sky noise is generally driven by the presence of the Milky Way at 144 MHZ. When close or aligned with the Moon, the Sun can also add to the Sky noise.
3) Moon Declination: generally speaking, for most EME practitioners who live in an urban areas, higher the Moon declination the better. Why? Simple, at low elevations, city and man-made noise can be prohibitively high so having the moon located at high elevations may help reducing the noise level very significantly.
 When we plot these 3 keys factors on the same graph, the combination of these should enable predicting the quality of the EME conditions that will be in effect at any given day or period of the month. Obviously, we are looking at a "semi-quantitative" analysis of the EME conditions here, not an absolute quantitative one.
EXAMPLE #1
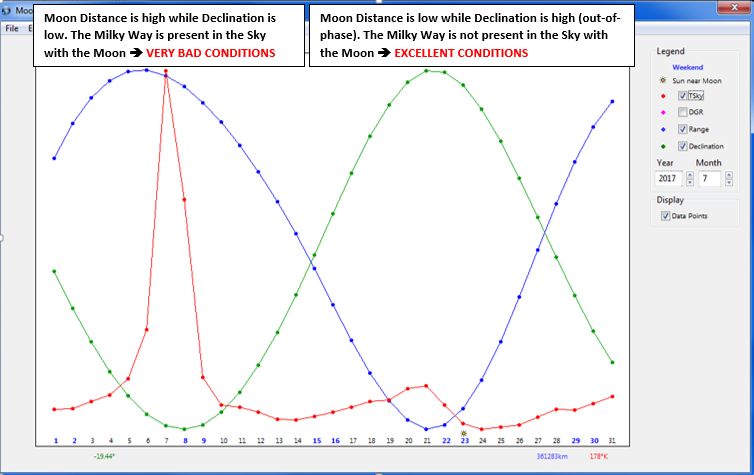
If we look at the first Moon Graph on top/right of the page (Year = 2017, Month = 7), from July 1 until July 15, the Moon distance gradually increases until it reaches a Maximum on July 7, and then the distance decreases again. To the contrary, during the same period, the Moon declination decreases until it reaches a minimum on July 8 and then starts increasing again (declination is out-of-phase with Moon distance). Finally, mainly due to the presence of the Milky Way, the Sky noise also increases from July 1 untill it reaches a maxium on July 8 and then decreases again.
The EME conditions resulting of the combination of these 3 factors is somewhat easy to forecast.