SECTION 21
NOISE POLARITY DIVERSITY
(May 1st, 2015)
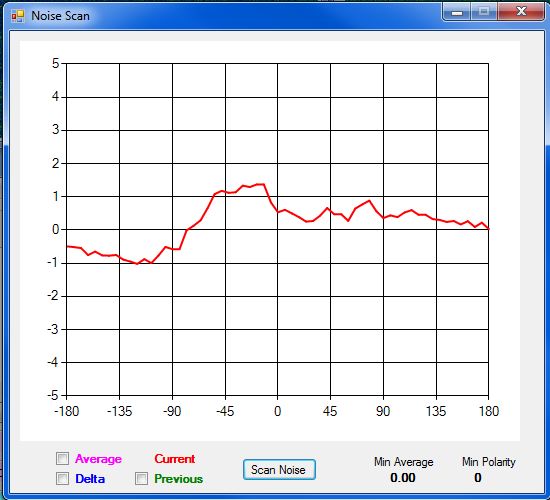
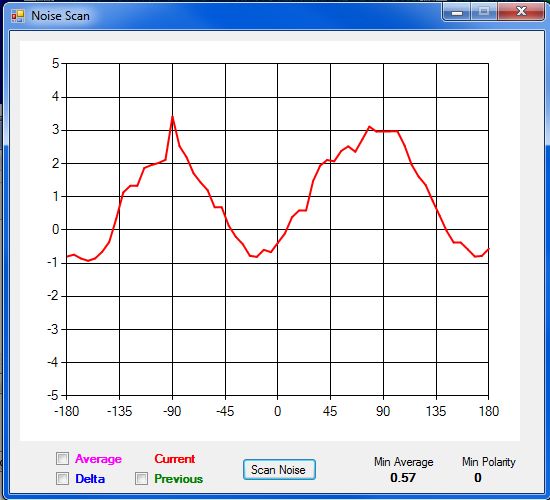
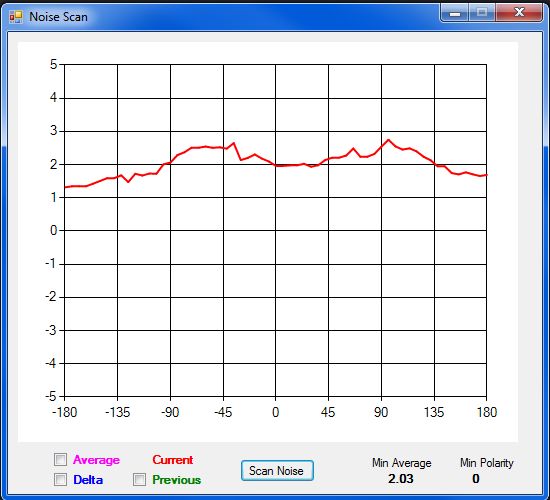
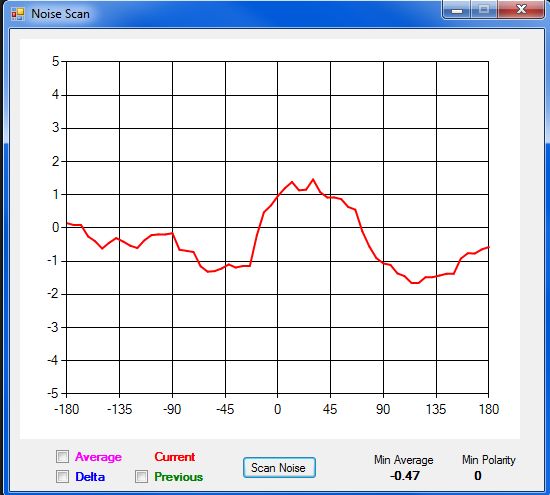
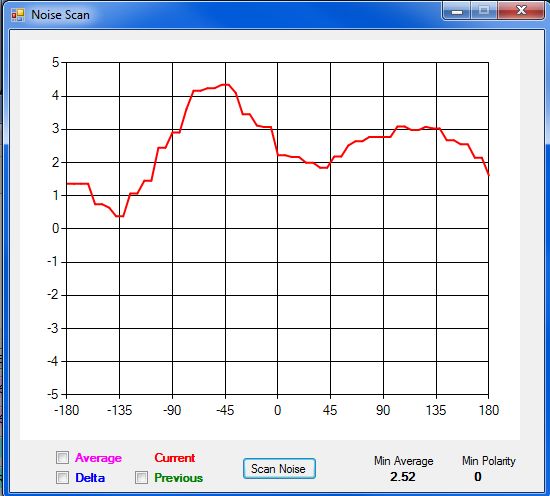
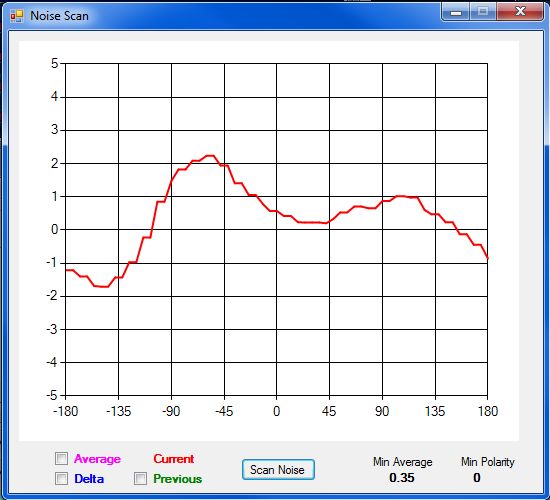
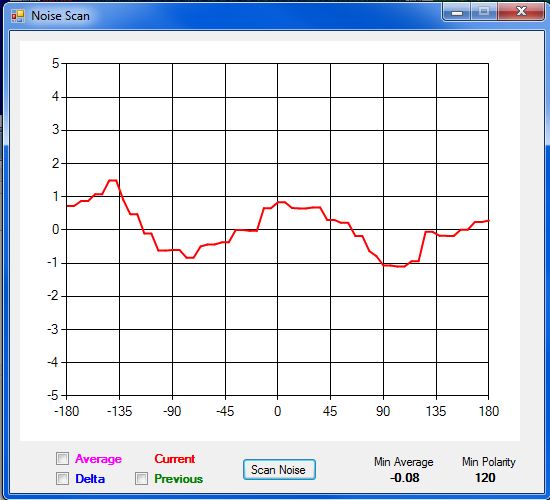
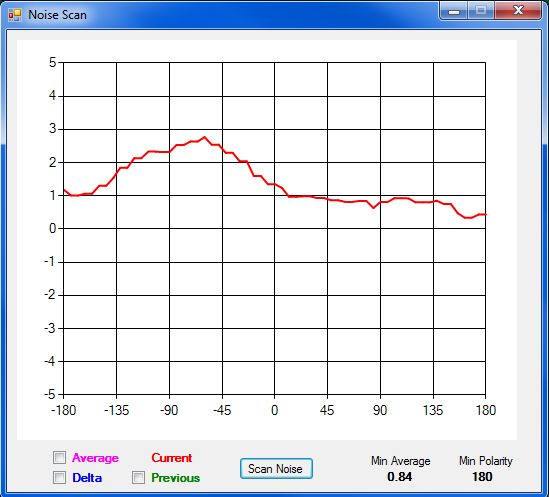
The new noise mapping capability described in Section 20 is immensely useful in order to better understand the impact of the Antenna Array polarization on the noise level and consequently, to take advantage of that precious information in order to maximize the performance of the EME station. Below a collection of noise maps produced sequentially the very same evening from AZ/EL ranging from 126deg AZ / 33 deg EL to 172deg AZ / 50 deg EL respectively. The "Y-Axis" represents the noise level recorded in WSJT and the "X-Axis" represents the polarity angle at which the noise level was recorded. The results are quite interesting. Here are some of the main take aways:
1) The noise is extraordinarily dynamic!
2) In an urban environment, there are no rules nor trends, except some reciprocal patterns at times, but even that is not consistent...
3) Typically, there are one or more "sweet spots" of lower noise levels which can be exploited.
4) The noise maps produced are extremely useful to maximize the EME station performance and to optimize the signal-to-noise ratio.
5) The Min/Max noise levels recorded in this experiment are often in the 1-3 dB range, which is very consequential in the world of EME.
More to come...
